
SEIV Web Visualization Platform
Overview
I led the development of the web-based visualization platform for the Socio-Economic-Infrastructure Vulnerability (SEIV) data generated in the Nature Communications publication “Block-level vulnerability assessment reveals disproportionate impacts of natural hazards across the conterminous United States.”
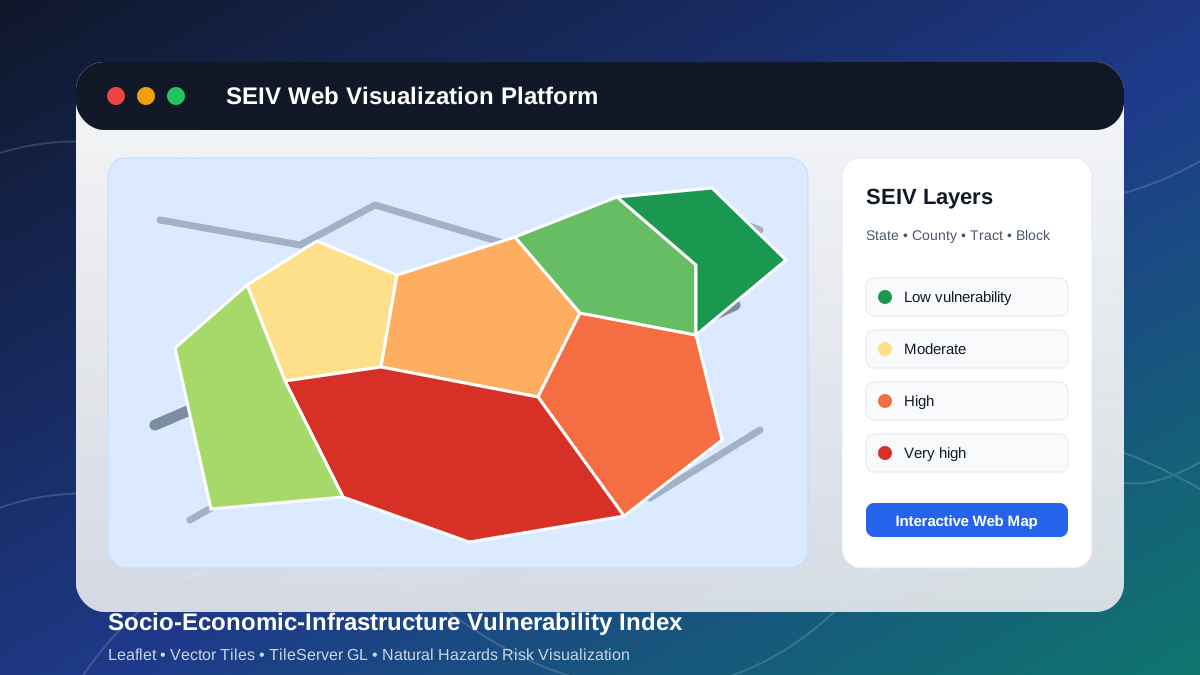
The platform turns publication-scale SEIV geospatial data into an interactive web map for exploring vulnerability patterns across the United States at multiple geographic levels, including state, county, census tract, census block, and enriched ZIP-level views.
My Role
- Led development of the web-based visualization platform.
- Designed and implemented the single-page interactive map interface.
- Integrated Leaflet-based web mapping with vector-tile SEIV layers.
- Implemented zoom-based layer switching across geographic scales.
- Added user-facing interaction features including hover labels, legends, chart summaries, search tools, fullscreen mode, and overlay controls.
- Connected the frontend visualization workflow to a TileServer GL/vector-tile backend for large geospatial datasets.
Key Features
- Interactive web map for SEIV vulnerability exploration.
- State, county, tract, block, and enriched ZIP-level visualization support.
- Automatic layer switching by zoom level.
- SEIV color styling and vulnerability index legend.
- Hover labels showing area names and vulnerability index values.
- Bar chart summaries for selected geographic levels.
- Search tools for places, states, and counties.
- U.S. Census TIGERweb boundary highlighting for search results.
- Fullscreen map and hide/show overlay controls.
Technical Stack
- Frontend: HTML, CSS, JavaScript
- Mapping: Leaflet, OpenStreetMap basemap
- Geospatial delivery: Vector tiles, MBTiles, TileServer GL
- Deployment workflow: UA HPC-hosted MBTiles data, TileServer GL, Cloudflare Tunnel, web map frontend
Research Context
The underlying SEIV dataset was developed to characterize spatial variation in vulnerability to natural hazards across the conterminous United States at census block resolution. The publication introduced a block-level SEIV index that incorporates socioeconomic and infrastructure-related contributors, including building count and distance to emergency facilities, and applies machine learning to estimate contributor weights.
Citation
Yarveysi, F., Alipour, A., Moftakhari, H. et al. Block-level vulnerability assessment reveals disproportionate impacts of natural hazards across the conterminous United States. Nature Communications 14, 4222 (2023). https://doi.org/10.1038/s41467-023-39853-z